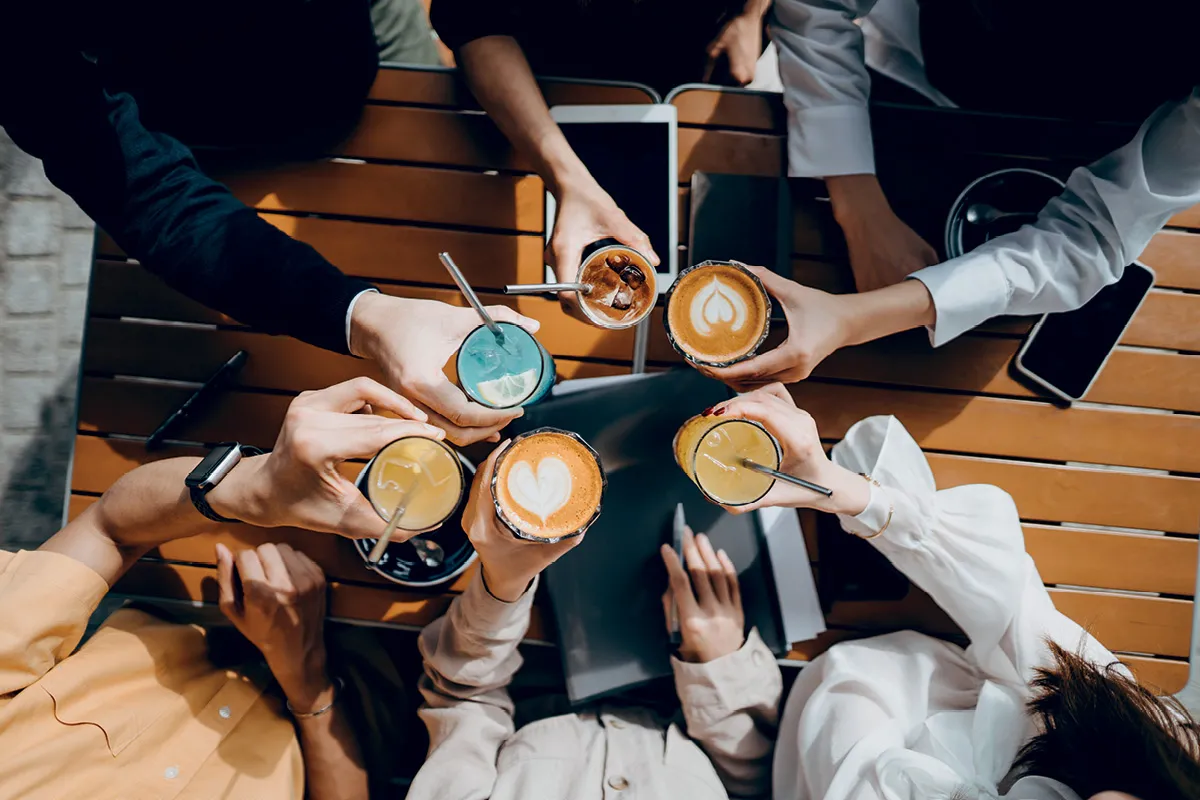
In 2024, the beverage industry is witnessing a remarkable shift as consumer preferences continue to evolve towards healthier and more functional options. Popular drinks are no longer confined to traditional categories; instead, they now encompass a wide range of innovative beverages that cater to diverse tastes and lifestyles. This article delves into the latest beverage trends, uncovering how consumers are spending on drinks and what factors are driving these changes.
From Simon-Kucher's State of Beverage Report, we analyze data from 3,000 US consumers, highlight key preferences by demographic, and explore the dynamics shaping the market for popular drinks and beverage trends. Whether it's the growing popularity of seltzers, sparkling water drinks, and other non-alcoholic beverages among Gen Z or the increasing health consciousness among millennials, understanding these trends is crucial for anyone in the beverage industry.
See here for beverage industry insights and complete methodology.
Popular Drinks: How Are Consumers Spending on Beverages in 2024?
Popular drinks by category
Which beverages are increasing in popularity* in 2024?
- Seltzers/sparkling water: +16%
- Fruit juices: +8%
Which beverages are decreasing in popularity* in 2024?
- Soft drinks: -12%
- Spirits: -11%
- Beer: -9%
- Wine: -9%
In 2024, US consumers are opting for healthier drinks and cutting spending on alcohol. Seltzers and sparkling beverages are attracting dollars among every age, gender, and income level of consumers except those with annual household incomes under $50,000.
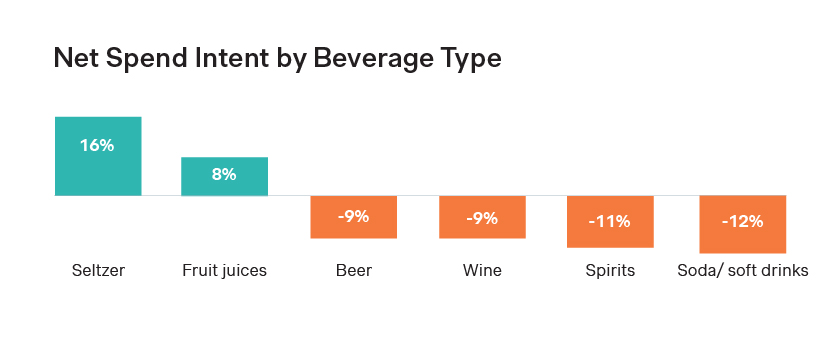
*Net Spend Intent = % consumers intending to increase spend - % consumers intending to decrease spend
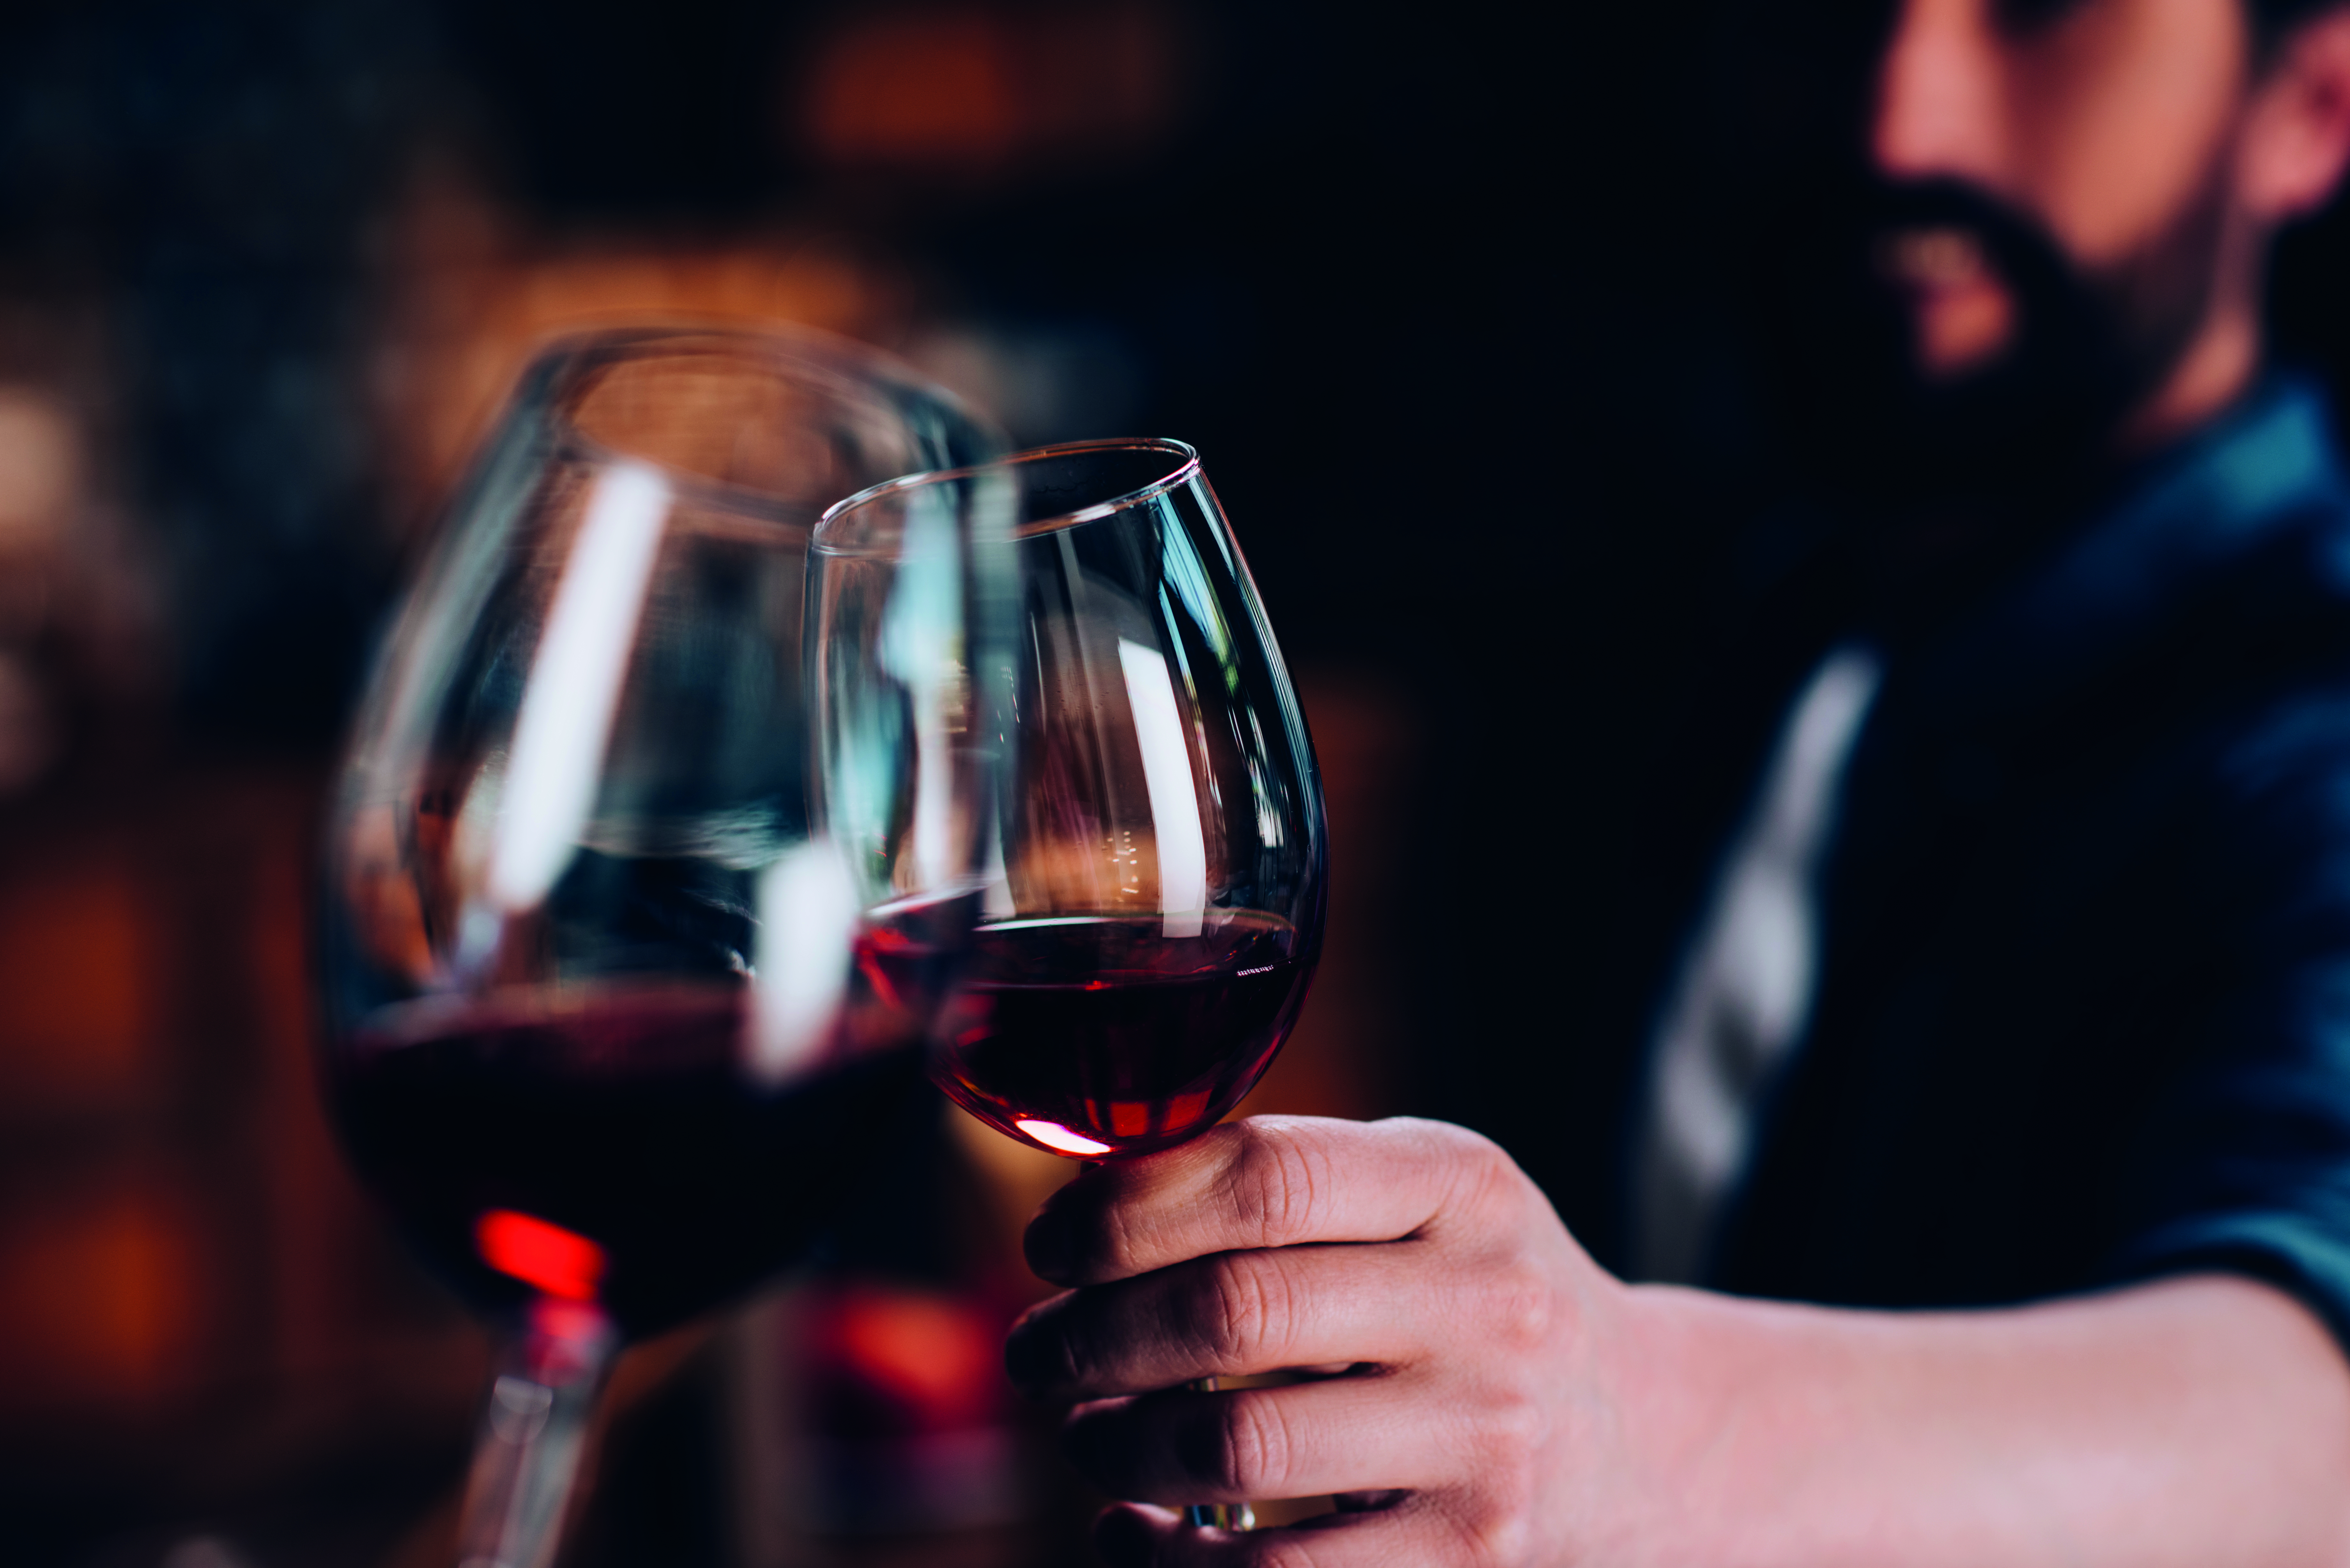
Alcoholic vs. Non-Alcoholic Drink Trends
- Consumers who drink alcohol: 67.2%
- Consumers who only drink non-alcohol: 32.8%
Both consumers and market trends demonstrate the growth of interest in non-alcoholic beverages – as well as a decline in some alcoholic beverage spending and consumption. In fact, the worldwide zero-ABV ‘spirits’ category is predicted to increase at a CAGR of 9% between 2023 and 2033, a Fact Market Research report revealed.
Beverage Preferences by Generation
Gen Z drinking trends
- Seltzers/sparkling: +31% net spend intent
- Wine: +21%
- Fruit juices: +2%
- Beer: -5%
- Soft drinks: -9%
- Spirits: -15%
58% of Gen Z drink alcohol and 42% do not (only within Gen Z consumers of legal drinking age).
In 2024, Gen Z consumers are increasing spend on seltzers and sparkling beverages the most, followed by wine and a small increase in fruit juices. On the other hand, Gen Z is less interested in spirits, beer, and soft drinks.
Overall, these trends mirror the consumer shift toward healthier beverages. However, Gen Z stands alone in its large increase in spending on wine. Whereas other generations are largely showing less interest in wine (other than millennials, where interest is flat), these younger drinkers clearly show a preference for it.
Millennial drinking trends
- Fruit juices: +20%
- Seltzers/sparkling: +18%
- Wine: +1%
- Soft drinks: -4%
- Beer: -6%
- Spirits: -12%
73.9% of Millennials drink alcohol and 26.1% do not.
Millennials demonstrate the greatest shift toward non-alcoholic and healthy beverages of any age group. Their interest in spending on fruit juices and seltzer/sparkling beverages is rising as their spend on alcoholic beverages – particularly spirits and beer – and soft drinks declines.
Gen X drinking trends
- Seltzers/sparkling: +11%
- Fruit juices: +4%
- Spirits: -7%
- Beer: -13%
- Wine: -14%
- Soft drinks: -15%
75% of Gen X drink alcohol and 25% do not. This group has the largest share of alcohol drinkers vs. non-alcohol drinks of any generation.
That said, Gen X consumers also indicate a reduced interest in spending on alcoholic beverages and a higher – if slightly less enthusiastic – interest in the seltzer and sparkling beverage craze. The group also demonstrates the greatest drop in spending on beer of any age group.
Baby boomer drinking trends
- Seltzers/sparkling: +13%
- Fruit juices: +1%
- Beer: -7%
- Spirits: -12%
- Wine: -15%
- Soft drinks: -16%
69.2% of Baby Boomers drink alcohol and 30.8% do not.
Baby boomers are the age group with the most non-alcoholic drinkers, and they also have the greatest decline in spending on alcoholic beverages, particularly on wine. These consumers also indicate reduced spending on soft drinks and increased spending on seltzers and sparkling drinks similar to that of Gen X consumers.
Why do people start or stop drinking certain beverages?
Top reasons for decreasing beverage consumption by category:
- Beer: Health
- Spirits: Expensive
- Wine: Health
- Soft drinks: Health
- Fruit juices: Health
- Seltzer/sparkling drinks: Expensive
Overall, consumers will opt to stop drinking a certain type of beverage due to their health or the cost. Otherwise, consumers simply don’t like certain types of beverages, and many also say they have started to use cannabis or CBD products as alternatives to certain drinks.
For alcoholic beverages, both beer and wine consumers cut their consumption due to health, but spirit drinkers cut it more due to cost than health. Interestingly, fruit juice drinkers are decreasing their consumption due to health, perhaps finding some juices too high in sugar. Some seltzer and sparkling drink consumers say those beverages are too costly for them and are cutting their consumption, and secondarily others say they just don’t like it very much.
Top reasons for increasing beverage consumption by category:
- Beer: Like it more than previously did
- Spirits: Like it more than previously did
- Wine: Like it more than previously did
- Soft drinks: Like it more than previously did
- Fruit juices: Health
- Seltzer/sparkling drinks: Health
Consumers who increase consumption of a certain beverage mostly do so for taste – simply, they like it more. For those increasing fruit juice and seltzer consumption, they do so for health reasons.
Where are consumers drinking?
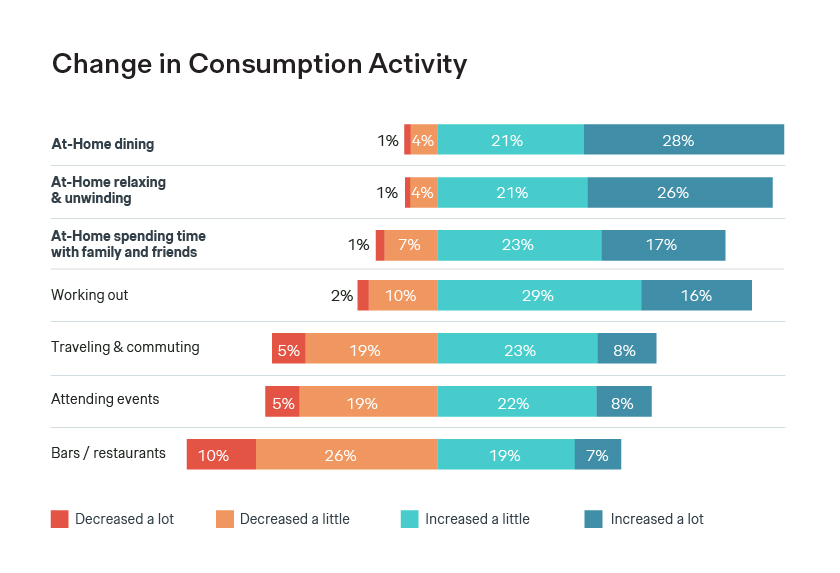
Consumers said that their behavior during the following occasion has shifted over the past 6 months:
- Dining at home: 5% decreasing, 49% increasing
- Relaxing & unwinding: 5% decreasing, 47% increasing
- Spending time with friends/family: 8% decreasing, 40% increasing
- Working out: 12% decreasing, 45% increasing
- Traveling & commuting: 24% decreasing, 31% increasing
- Attending events: 24% decreasing, 30% increasing
- Bars/restaurants: 36% decreasing, 26% increasing
As a result, we wanted to know:
How is beverage spend changing based on where consumers are drinking?
- Buy to drink during a sport or workout: +13%
- Bring from home to drink during a sport or workout: +13%
- Bring from home to drink on the go: +10%
- Buy to drink on the go: +3%
- At-home meal: -2%
- At an event: -5%
- At a bar/restaurant: -6%
- At-home relaxation: -7%
- At home time with family and friends: -8%
Consumers are drinking more "on the go” and during out-of-home workouts or sporting activities. On the other hand, they are opting to reduce spending at bars and restaurants, events, and at home, regardless of whether they are socializing or relaxing.
In 2024, consumers favor healthier drinks like seltzers and sparkling beverages while reducing alcohol consumption. Under these headline trends, the picture is nuanced. As always, the beverage brands that win will be the ones that can most quickly zero in on what their consumers want and how their consumption habits are changing.
For additional information, including strategic recommendations for beverage industry executives and complete report data and methodology, please contact
pr-inquiries@simon-kucher.com


