
Several high-profile bank failures in the US have generated headlines for the past year, drawing attention to the risks lurking on bank balance sheets. The first and largest of these, Silicon Valley Bank (SVB), fell because the market value of its fixed income investments, once reliably stable, dropped substantially as interest rates ascended sharply. More recently, New York Community Bank (NYCB) required a recapitalization led by outside investors. The value of its large commercial real estate loan portfolio plummeted as office occupancy rates remained stubbornly depressed in the post-COVID environment. The common thread across these failures was deposit flight.
Simon-Kucher recently examined the relationship between deposit flight and bank failure to assess how much of the banking sector might be at risk of similar runs, determine what can be done to strengthen deposit stability, and assess the impact on bank profitability. We see three lessons for the banking industry:
1. Insured deposits act as a breakwater and buy extra time for bank management to cope with balance sheet risks on the asset side
a. Insured deposits have been stable even when disaster strikes the asset side of the balance sheet
b. Deposit runs at institutions perceived as weak have been concentrated in uninsured deposits
2. While most of the banking sector, including the largest institutions, is currently safe, many smaller regional institutions (less than $100 billion in assets) are exposed to asset risk and are reliant on uninsured deposits
3. Shifting these regionals to a more stable deposit mix with a higher level of insured deposits is likely to have a significant negative impact on their profitability
Looking ahead, we see a mix of challenges and opportunities for bank CFOs and deposit management executives:
· Pressure on less secure banks to raise insured deposit levels while holding down increases in their cost of funds
· Spillover “price wars” for all competitors in the footprint of deposit-hungry banks
· Room for secure banks that have been paying above median rates to lower their rate differentials and improve margins
For those institutions under pressure, the ability to grow deposits efficiently will be a critical differentiator: in our experience, high efficiency deposit growers can raise deposits at half the incremental expense of low efficiency deposit growers.
Insured deposits act as a breakwater and buy extra time
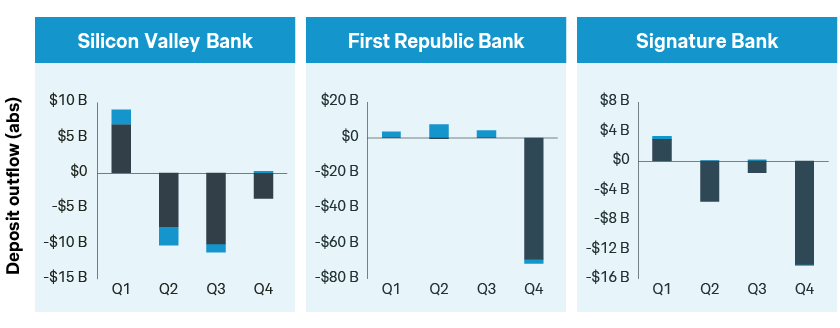
What really happened at failed banks? Investors and depositors began to flee after problems in fixed-income portfolios and commercial real estate emerged. Once triggered, deposit flight snowballed and was hard to stop. However, the avalanche was unevenly distributed – insured deposits remained stable, while uninsured deposits rushed out. Our analysis shows that uninsured deposits at affected banks began to collapse within 90 days of perceived balance sheet risk, hitting peak outflows within one to three quarters. The average balances in these uninsured accounts were as high as $1.5 million, magnifying the impact of losing even a small number of them.
None of the three banks represented above survived. In contrast, New York Community Bank was less dependent on uninsured deposits. While investors fled and its share price plummeted as the extent of its commercial real estate exposure become known, its deposit base remained stable. Management found private investors willing to recapitalize the institution. In fairness, the apparent willingness of the FDIC – demonstrated during the prior failures - to protect all deposits, insured or not, may have also contributed to the difference in outcome.
While most of the banking sector, including the largest institutions, is currently safe, many smaller regional institutions (less than $100 billion in assets) are exposed to asset risk and are reliant on uninsured deposits.
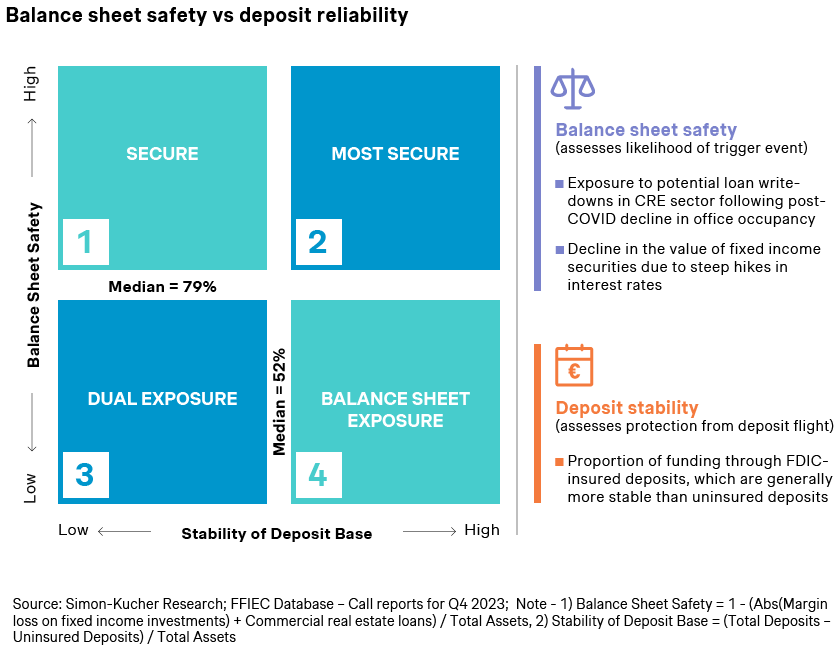
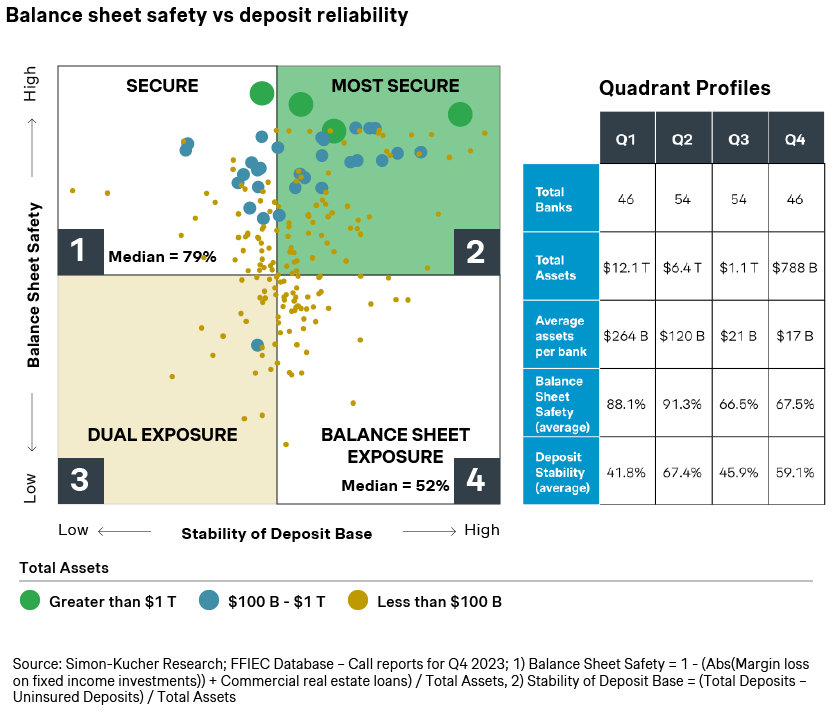
We benchmarked the 200 largest banks in the US on two measures: balance sheet safety, which assesses the likelihood of a trigger event that would prompt a potential bank run, and deposit stability, which measures a bank’s level of protection from deposit flight. We then grouped the banks into quadrants based on where they fell against median levels for the two measures.
The US banking sector is generally secure in aggregate, but exposure is concentrated among smaller regional banks in Quad 3 and Quad 4. More than 50 institutions, accounting for more than $1 trillion in assets, fall into Quad 3, indicating high exposure to asset risk and significant reliance on uninsured deposits. Quad 4 institutions, slightly smaller than those in Quad 3, rely less on uninsured deposits, but are also exposed to asset risk.
Shifting these regionals to a more stable deposit mix with a higher level of insured deposits is likely to have a significant negative impact on their profitability.
We also benchmarked the cost of funds for institutions in each quadrant. Within Quad 3 and Quad 4, we find 60 banks currently paying below median levels for cost of funds. If these institutions move to raise insured deposits by paying more, increasing their cost of funds to median levels, they potentially risk 35-40% of their current return on assets.
Conversely, a significant number of Quad 1/Quad 2 banks are priced at levels not demanded by their risk profile (though factors other than risk like competition may dictate otherwise.) For them, price harvesting and margin enhancement strategies may be appropriate.